Parametric analysis with EnergyPlus and Python
How is possible to run multiple EnergyPlus simulations with different parameters? How can I see the effect of changing a parameter on the simulation results? How can I automate this process? This blog post describes how to do parametric analysis using EnergyPlus and Python.

What is parametric analysis?
Parametric analysis means studying the impact of changing one variable on another variable. In building design this can be used to answer such questions as:
- what is the impact of building orientation on solar gains?
- what is the impact of insulation thickness on heating energy consumption?
- what is the impact of window-to-wall ratio on internal air tempertures?
How to do parametric analysis in EnergyPlus?
With EnergyPlus, we can do parametric analysis by varying the parameter in the input file and viewing the change in the simulation results. The key steps are:
- Create a base-case EnergyPlus input file.
- Make changes to the base-case input file to create a series of input files which contain the changes to the parameter you are studying.
- Run EnergyPlus simulations on the series of input files.
- Analyse the results of the simulations.
How to make changes to the base-case input file?
First, read the base-case input file into Python. Here we are using the .epJSON format.
import json
with open('base_case.epJSON') as f:
    epjson = json.load(f)
Next creates a list of values which are the new values for the parameter being changed. The code below creates a ten-item list with the values 0.5, 1.0, 1.5, 2.0, 2.5, 3.0, 3.5, 4.0, 4.5 and 5.0.
new_values = [x*0.5 for x in range(1,11)]Finally modify the epjson variable to create new input files with the change in the parameter. The code below modifies the thermal resistance layer of the 'R13LAYER' material. Ten new .epJSON files are created and saved.
for i in new_values:
    epjson_new = epjson
    epjson_new['Material:NoMass']['R13LAYER']['thermal_resistance'] = i
    with open(f'base_case_wall_thermal_resistance_{i}.epJSON', 'w') as f:
        json.dump(epjson_new, f, indent = 4)
How to run multiple EnergyPlus simulations?
EnergyPlus simulations can be run by creating a command line string (cl_st in the code below) and then using subprocess.run to run the command.
import subprocess
energyplus_install_dir = r'C:\EnergyPlusV9-6-0'
epw_relative_filepath = 'my_weather_file.epw'
for i in new_values:
    input_file = f'base_case_wall_thermal_resistance_{i}.epJSON'
    cl_st = (f'"{energyplus_install_dir}\\EnergyPlus" '
             + f'--output-prefix thermal_resistance_{i}_ '
             + '--readvars '
             + f'--output-directory output_files '
             + f'--weather "{epw_relative_filepath}" '
             + f'"{input_file}"'
             )
    subprocess.run(cl_st, capture_output = True)
This code sets up a loop. In each loop iteration it assigns the file name of one of the newly-created .epJSON files to the input_file variable. An EnergyPlus simulation is then run using the .epJSON as the input. The results are saved in the 'output_files' folder. Each set of results is given a different name, using the prefix 'thermal_resistance_0.5_', 'thermal_resisitance_1.0_' etc.
At the end of this process there will be around 200 files in the 'output_files' folder, 20 for each simulation run.
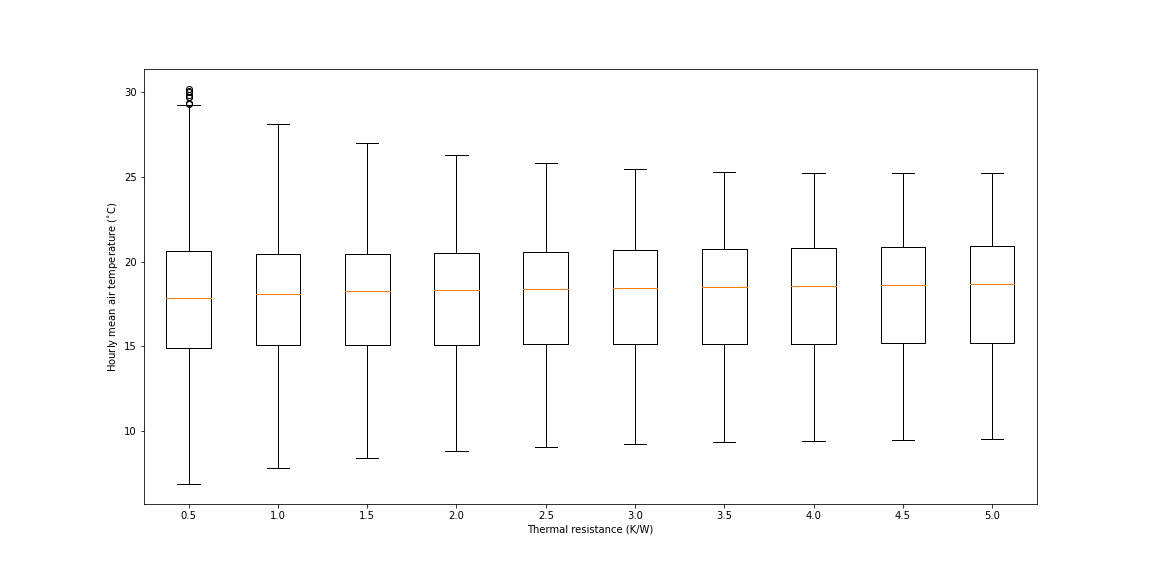
How to analyse the simulation results?
In the 'output_files' folder there are 10 .csv files which end with 'out.csv'. These contain the simulation results for the 10 different input files.
A good approach to start to analyse this data is to load all 10 .csv files into a single Pandas dataframe. The code below does this by creating a list of 10 dataframes, one for each of the .csv files, and then using the pandas.concat method to join all the dataframes together. Note a new column is created named 'simulation_run' which is used to record which simulation run each row belongs to.
import pandas as pd
x = []
for i in new_values:
    fp = f'output_files//thermal_resistance_{i}_out.csv'
    df_temp = pd.read_csv(fp)
    df_temp['simulation_run'] = f'thermal_resistance_{i}'
    x.append(df_temp)
df = pd.concat(x)
This dataframe can now be analysed using Pandas to create graphs and tables of the results.
Next steps
- The code in this blog post is a shortened version to demonstrate the prinicipals. For a full working example, please view the Jupyter Notebook on nbviewer here: https://nbviewer.org/github/stevenkfirth/stevenfirth/blob/main/parametric-analysis-with-energyplus-and-python/Parametric_analysis_with_EnergyPlus_and_Python.ipynb
- View the full working example with the files on GitHub here: https://github.com/stevenkfirth/stevenfirth/tree/main/parametric-analysis-with-energyplus-and-python
- For more details on editing EnergyPlus input files, please see this post: https://www.stevenfirth.com/5-ways-to-edit-energyplus-input-files/
- For more details on running EnergyPlus using the command line, please see this post: https://www.stevenfirth.com/how-to-run-energyplus-from-the-command-line/
- For more details on running EnergyPlus with Python, please see this post: https://www.stevenfirth.com/energyplus-simulation-and-analysis-using-python/