EnergyPlus simulation and analysis using Python
Do you want to automate your EnergyPlus workflow? Then use Python for both running simulations and analysing the results.

The EnergyPlus website describes the EnergyPlus software as 'a console-based program that reads input and writes output to text files'. This means that EnergyPlus is ideal for automation using programming languages, as two things that all programming languages do very well is running console programs and reading/writing text files.
What is a console program? Essentially this is a program that can be run using the command line interface. Wikipedia describes console applications here as ' a computer program designed to be used via a text-only computer interface, such as a text terminal, the command-line interface of some operating systems (Unix, DOS,[1] etc.) or the text-based interface included with most graphical user interface (GUI) operating systems, such as the Windows Console in Microsoft Windows,[2] the Terminal in macOS, and xterm in Unix.'
This post builds on my previous post 'How to run EnergyPlus from the command line' by using Python to run EnergyPlus via the command line. It also shows how to start analysing the results files of an EnergyPlus simulation using Python.
An accompanying Jupyter notebook for this post can be viewed on Jupyter nbviewer here and GitHub here.
Using Python to call the energyplus.exe file
In Python we can use the subprocess.run method to work with the command line interface. This means that a Python script written and run in a Jupyter notebook or other Python environment can send commands to the command line interface. The command is run and any results can be returned back to the Python program.
The code below run the energyplus.exe file with the --help option.
import subprocess
energyplus_install_dir=r'C:\Users\cvskf\EnergyPlusV9-6-0'
cl_st=f'{energyplus_install_dir}\\EnergyPlus --help'
result=subprocess.run(cl_st,
                      capture_output=True
)--help optionWhat's happening here? Here is a line-by-line description:
- The
subprocessmodule is imported. - The variable
energyplus_install_diris set to the local install directory of EnergyPlus. This is where EnergyPlus is installed on my computer - please change this to your local EnergyPlus install directory. - The
cl_stvariable (so named for 'command line string' ) is set to the install directory plus 'energyplus --help'. This is the complete command required by the command line interface to call EnergyPlus with the--helpoption. - The
subprocess.runmethod is called passing thecl_ststring is the first argument. This runs thecl_stcommand in the command line and returns a results object which is places in theresultvariable. The optioncapture_output=Truemeans that this results object will include any text that would have been printed on the command line interface as the command was run.
Did it work? We can see this by examining the results variable. The subprocess.run method returns something called a CompletedProcess instance which has a number of properties which can be printed out. Here is the code to do this:
print('---ARGS---\n',result.args)
print('---RETURNCODE---\n',result.returncode, '(SUCCESS)' if result.returncode==0 else '(FAIL)')
print('---STDOUT---\n',result.stdout.decode())
print('---STDERR---\n',result.stderr.decode())CompletedProcess instance returned by subprocess.runThis gives the following output:
---ARGS---
 C:\Users\cvskf\EnergyPlusV9-6-0\EnergyPlus --help
---RETURNCODE---
 0 (SUCCESS)
---STDOUT---
 EnergyPlus, Version 9.6.0-f420c06a69, YMD=2022.03.01 07:04
PythonLinkage: Linked to Python Version: "3.9.7 (tags/v3.9.7:1016ef3, Aug 30 2021, 20:19:38) [MSC v.1929 64 bit (AMD64)]"
Built on Platform: Windows_x86_64
Usage: energyplus [options] [input-file]
Options:
  -a, --annual                 Force annual simulation
  -c, --convert                Output IDF->epJSON or epJSON->IDF, dependent on
                               input file type
  -d, --output-directory ARG   Output directory path (default: current
                               directory)
  -D, --design-day             Force design-day-only simulation
  -h, --help                   Display help information
  -i, --idd ARG                Input data dictionary path (default: Energy+.idd
                               in executable directory)
  -j, --jobs ARG               Multi-thread with N threads; 1 thread with no
                               arg. (Currently only for G-Function generation)
  -m, --epmacro                Run EPMacro prior to simulation
  -p, --output-prefix ARG      Prefix for output file names (default: eplus)
  -r, --readvars               Run ReadVarsESO after simulation
  -s, --output-suffix ARG      Suffix style for output file names (default: L)
                                  L: Legacy (e.g., eplustbl.csv)
                                  C: Capital (e.g., eplusTable.csv)
                                  D: Dash (e.g., eplus-table.csv)
  -v, --version                Display version information
  -w, --weather ARG            Weather file path (default: in.epw in current
                               directory)
  -x, --expandobjects          Run ExpandObjects prior to simulation
--convert-only                 Only convert IDF->epJSON or epJSON->IDF,
                               dependent on input file type. No simulation
Example: energyplus -w weather.epw -r input.idf

---STDERR---
This shows that EnergyPlus was called sucessfully. The args property gives the intial call that was passed to the command line. The returncode property is 0 if the command ran successfully. The stdout propoerty gives the text which would have been created on the command line interface. And the stderr propoerty reports on any errors - none in this case.
Using Python to run an EnergyPlus simulation
So now we have the basic process up and running, we can extend this to run a full EnergyPlus simulation. I am using the '1ZoneUncontrolled.idf' EnergyPlus input data file from the ExampleFiles directory which comes with the EnergyPlus install and the 'USA_CA_San.Francisco.Intl.AP.724940_TMY3.epw' weather file. The simulation results are being placed in a folder called 'sim' and both the input data file and weather file are placed in this folder.
Here is the code to create the command line string:
idf_relative_filepath=r'sim\1ZoneUncontrolled.idf'
epw_relative_filepath=r'sim\USA_CA_San.Francisco.Intl.AP.724940_TMY3.epw'#
output_relative_directory='sim'
cl_st=(f'"{energyplus_install_dir}\\EnergyPlus" '
       + '--readvars '  # included to create a .csv file of the results
       + f'--output-directory "{output_relative_directory}" '
       + f'--weather "{epw_relative_filepath}" '
       + f'"{idf_relative_filepath}"'
      )
print(cl_st)This gives the following output:
"C:\Users\cvskf\EnergyPlusV9-6-0\EnergyPlus" --readvars --output-directory "sim" --weather "sim\USA_CA_San.Francisco.Intl.AP.724940_TMY3.epw" "sim\1ZoneUncontrolled.idf"Here I am using the --readvars option which asks EnergyPlus to create a csv file of the results and the --output-directory option to specifiy where I want the results to be placed. I'm using double quotes around the file paths just in case they contain space characters (they don't in the example above but might do in the other cases). The file paths given here are relative, and so the results files will be placed in a folder called 'sim' which is located in the same place where the Python code is being run. Please note that the 'sim' folder will need to be manually created before running this code.
Let's now run a simulation. Here is the code:
result=subprocess.run(cl_st,
                      capture_output=True
                     )
print('---ARGS---\n',result.args)
print('---RETURNCODE---\n',result.returncode, '(SUCCESS)' if result.returncode==0 else '(FAIL)')
print('---STDOUT---\n',result.stdout.decode())
print('---STDERR---\n',result.stderr.decode())cl_st defined above)This gives the following output :
---ARGS---
 "C:\Users\cvskf\EnergyPlusV9-6-0\EnergyPlus" --readvars --output-directory "sim" --weather "sim\USA_CA_San.Francisco.Intl.AP.724940_TMY3.epw" "sim\1ZoneUncontrolled.idf"
---RETURNCODE---
 0 (SUCCESS)
---STDOUT---
 EnergyPlus Starting
EnergyPlus, Version 9.6.0-f420c06a69, YMD=2022.03.01 07:04
Adjusting Air System Sizing
Adjusting Standard 62.1 Ventilation Sizing
Initializing Simulation
Reporting Surfaces
Beginning Primary Simulation
Initializing New Environment Parameters
Warming up {1}
Warming up {2}
Warming up {3}
Warming up {4}
Warming up {5}
...
...
EnergyPlus Run Time=00hr 00min  1.74sec

---STDERR---
 EnergyPlus Completed Successfully.
Success! The output above has been shortened as there is a lot of output for an EnergyPlus run (see the Jupyter notebook for the full ouput here). If you look in the 'sim' directory you should now see many different EnergyPlus results files, including a .csv file of the simulation results.
Using Python to analyse EnergyPlus results
In the approach above, an EnergyPlus simulation was run and a .csv results file was generated. This csv file contain the hour-by-hour results of the simulation and includes variables such as energy consumption and internal air temperatures.
As this is a csv file it can be analysed using Python. The example below uses the Pandas package to read in the csv data and the Matplotlib package to create a graph.
One slight complication is that Pandas will not be able to interpret the way that EnergyPlus results files store their date and time variables. So before reading in the csv results data a function is created that can convert an EnergyPlus datetime string to a pandas.Timestamp instance:
def parse_energyplus_datetime_string(st, year=2021):
    st=st.strip()
    month=int(st[0:2])
    day=int(st[3:5])
    hour=int(st[7:9])
    minute=int(st[10:12])
    second=(st[13:15])
    if not hour==24:
        dt=pd.Timestamp(year,month,day,hour,minute)
    else:
        hour=0
        dt=pd.Timestamp(year,month,day,hour,minute)
        dt+=pd.Timedelta('1 day')
return dtNow we can use the pandas.read_csv method to load the csv results data and various matplotlib methods to create an example plot:
import pandas as pd
import matplotlib.pyplot as plt
df=pd.read_csv(r'sim\eplusout.csv',
               parse_dates=[0],
               index_col=[0],
               date_parser=parse_energyplus_datetime_string
              )
fig, ax = plt.subplots(figsize=(16,6))
ax.plot(df['ZONE ONE:Zone Mean Air Temperature [C](Hourly)'][48:],
        color='grey',
        linewidth=0.75
       )
ax.set_xlabel('Date')
ax.set_ylabel('Air temperature (${^o}C$)')
plt.show()Here is the plot generated from the code above:
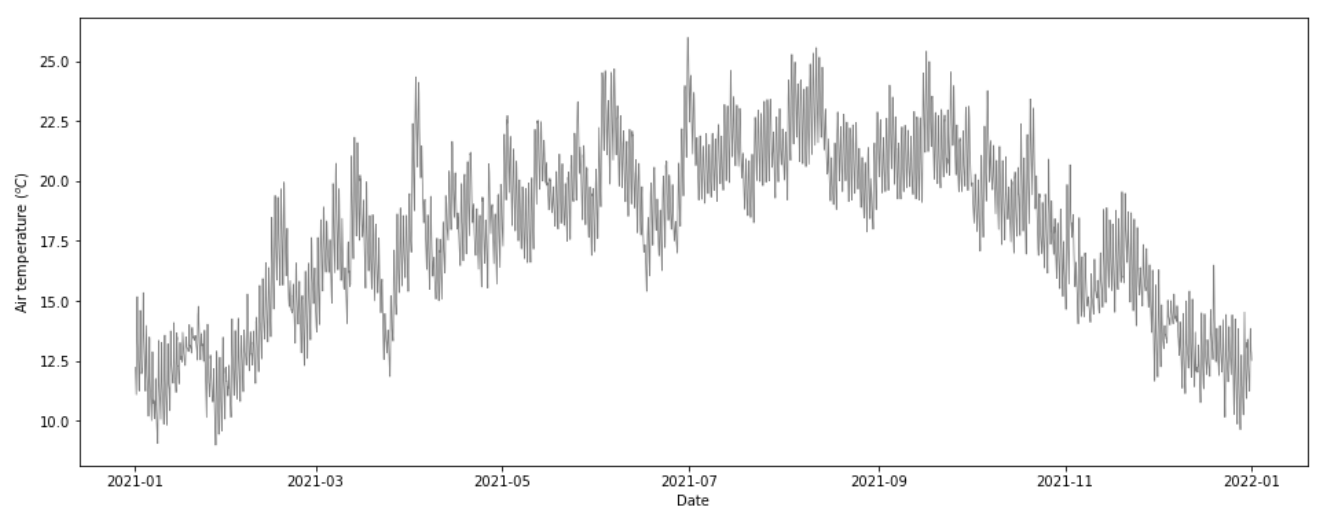
This is just a quick example to demonstrate the potential of using Python to analyse EnergyPlus results.
Next steps
- Look at the Jupyter notebook accompanying this post here.
- Read the previous post on 'How to run EnergyPlus from the command line'
- Experiment with the different command line options in the EnergyPlus call.
- Expand the analysis above to different graphs and tables summarising the results in the EnergyPlus results file.