CSV on the Web: Working with EnergyPlus results
This post looks at how share EnergyPlus results using the CSV on the Web (CSVW) format. This work was done with Syafiq Saiful as part of the ABCE Open Data Project.

Introduction
The ABCE Open Data Project is studying how different types of data can be published and shared in open, transparent and reusable ways in line with the FAIR data guidelines. This work considers the case of simulation or modelling data, when an engineering model generates an output file of prediction results based on a given set of inputs.
Here the EnergyPlus building simulation software is used. A simulation is run using the ‘1ZoneUncontrolled.idf’ input file, taken from the Examples folder of the EnergyPlus installation. The weather file ‘USA_CA_San.Francisco.Intl.AP.724940_TMY3.epw’ is used. Once the simulation is run there are a number of different output files. In this work we consider the CSV file of prediction results, which is named ‘eplusout.csv’.
The eplusout.csv results file.
The ‘eplusout.csv’ file is a CSV file of results from an EnergyPlus simulation run. The file contains a number of columns each relating to the results variables as shown below:
Date/Time,Environment:Site Outdoor Air Drybulb Temperature [C](Hourly),Environment:Site Total Sky Cover [](Hourly),Environment:Site Opaque Sky Cover [](Hourly),Environment:Site Daylight Saving Time Status [](Daily),Environment:Site Day Type Index [](Daily),ZONE ONE:Zone Total Internal Latent Gain Energy [J](Hourly),TEST 352A:Other Equipment Total Heating Energy [J](Monthly),TEST 352 MINUS:Other Equipment Total Heating Energy [J](Monthly),ZONE ONE:Zone Other Equipment Total Heating Energy [J](Monthly),ZONE ONE:Zone Mean Radiant Temperature [C](Hourly),ZN001:WALL001:Surface Inside Face Temperature [C](Daily),ZN001:WALL001:Surface Outside Face Temperature [C](Daily),ZN001:WALL001:Surface Inside Face Convection Heat Transfer Coefficient [W/m2-K](Daily),ZN001:WALL001:Surface Outside Face Convection Heat Transfer Coefficient [W/m2-K](Daily),ZN001:WALL002:Surface Inside Face Temperature [C](Daily),ZN001:WALL002:Surface Outside Face Temperature [C](Daily),ZN001:WALL002:Surface Inside Face Convection Heat Transfer Coefficient [W/m2-K](Daily),ZN001:WALL002:Surface Outside Face Convection Heat Transfer Coefficient [W/m2-K](Daily),ZN001:WALL003:Surface Inside Face Temperature [C](Daily),ZN001:WALL003:Surface Outside Face Temperature [C](Daily),ZN001:WALL003:Surface Inside Face Convection Heat Transfer Coefficient [W/m2-K](Daily),ZN001:WALL003:Surface Outside Face Convection Heat Transfer Coefficient [W/m2-K](Daily),ZN001:WALL004:Surface Inside Face Temperature [C](Daily),ZN001:WALL004:Surface Outside Face Temperature [C](Daily),ZN001:WALL004:Surface Inside Face Convection Heat Transfer Coefficient [W/m2-K](Daily),ZN001:WALL004:Surface Outside Face Convection Heat Transfer Coefficient [W/m2-K](Daily),ZN001:FLR001:Surface Inside Face Temperature [C](Daily),ZN001:FLR001:Surface Outside Face Temperature [C](Daily),ZN001:FLR001:Surface Inside Face Convection Heat Transfer Coefficient [W/m2-K](Daily),ZN001:ROOF001:Surface Inside Face Temperature [C](Daily),ZN001:ROOF001:Surface Outside Face Temperature [C](Daily),ZN001:ROOF001:Surface Inside Face Convection Heat Transfer Coefficient [W/m2-K](Daily),ZN001:ROOF001:Surface Outside Face Convection Heat Transfer Coefficient [W/m2-K](Daily),ZONE ONE:Zone Mean Air Temperature [C](Hourly),ZONE ONE:Zone Air Heat Balance Surface Convection Rate [W](Hourly),ZONE ONE:Zone Air Heat Balance Air Energy Storage Rate [W](Hourly)
 12/21  01:00:00,-15.5,1.25,1.25,,,0.0,,,,-18.208257429442167,,,,,,,,,,,,,,,,,,,,,,,,-18.210957916180156,-0.035919116169558674,-0.03599015482956486
 12/21  02:00:00,-15.5,3.25,3.25,,,0.0,,,,-18.208346242455278,,,,,,,,,,,,,,,,,,,,,,,,-18.211044743036272,-0.035356039748359436,-0.03542596637573524
 12/21  03:00:00,-15.5,3.375,3.375,,,0.0,,,,-18.208433661882808,,,,,,,,,,,,,,,,,,,,,,,,-18.211130208729628,-0.03480177731580003,-0.034870609273411936
 12/21  04:00:00,-15.5,1.125,1.125,,,0.0,,,,-18.208519709584017,,,,,,,,,,,,,,,,,,,,,,,,-18.21121433456837,-0.03425619137291136,-0.034323945731721824
 12/21  05:00:00,-15.5,1.875,1.875,,,0.0,,,,-18.208604407075555,,,,,,,,,,,,,,,,,,,,,,,,-18.211297141528142,-0.03371914654842012,-0.03378584012708481
The first column is always the ‘Date/Time’ column and the remaining columns vary depending on what is asked for in the .idf input file. In our case the second column has the header ‘Environment:Site Outdoor Air Drybulb Temperature [C] (hourly)’. This means:
- The variable is about the ‘Environment’, i.e. the outdoor or external conditions.
- The quantity is the ‘Site Outdoor Air Drybulb Temperature’, which is a type of air temperature quantity that we can either measure or calculate.
- The units are ‘C’, i.e. degrees Celsius.
- The time interval is ‘hourly’, i.e. for this variable predictions are made for every hour.
The rows in the CSV file are the simulation predictions for each time stamp. The file first contains the results for a single day (24 rows, the winter design day on 21st December) and then the results for another single day (24 rows, the summer design day on 21st July). Following this there are 8,760 further rows which represent the predictions on an hour-by-hour basis for a complete year.
Two interesting things to note about this CSV file are:
- The timestamps (column 1) are in a non-standard format. No year value is provided and midnight is recorded with a time of ‘24:00:00’ (rather than the more standard ‘00:00:00).
- Where the variables have time intervals such as ‘daily’ or ‘monthly’ then this results is missing values for the intervening hourly rows. So a variable recorded daily will have a single result, then 23 rows of blank or missing data, and then the next daily result.
Converting the result to CSVW format
The ‘eplusout.csv’ file is fairly understandable but we can improve this by converting the file to CSVW format (see here for an Introduction to CSVW). This will place the header data into a more formal and easier to access format which will allow us to analyse the data in a quicker and easier fashion.
The two principles for converting the data to CSV format are:
- To not make changes to the initial CSV data unless necessary. This makes the process much easier and reproducible, and means that someone who understands EnergyPlus output CSV files but doesn’t understand CSVW will still be able to use the data.
- To create a CSVW metadata file (a metadata.json file) to accompany the CSV data. This metadata file will contain more information about the data as a whole and about the individual columns.
Creating the metadata.json file
To create the metadata.json file we follow the process outlined in the blog post CSV on the Web: Creating descriptive metadata files.
Table Description object
To create a metadata.json file for the ‘eplusout.csv’ file, we first create a Table Description object as follows:
{
    "@context": "<http://www.w3.org/ns/csvw>",
    "@type": "Table",
    "url": "eplusout.csv",
    "dc:title": "EnergyPlus simulation test",
    "dc:description": "An EnergyPlus simulation of an office room in Sir Frank Gibb building, Loughborough University",
    "dc:creator": "ABCE Open Research Team",
    "tableSchema": {
        "@type": "Schema",
        "columns": []
}
This follows the standard format for a Table Description metadata object. The metadata.json file will be placed in the same folder as the ‘eplusout.csv’ file, so we can use a relative reference for the url property. The Dublin Core vocabulary is used to provide additional information about the data.
The Date/Time Column Description object
Next we need to provide the Column Description objects for the columns property. Here is the Column Description object for the ‘Date/Time’ column:
{
    "@type": "Column",
    "titles": "Date/Time",
    "dc:description": "Date/Time",
    "schema:variableMeasured": "Date/Time",
    "datatype": "string",
    "rdfs:comment": "The Date/Time column contains a non-standard date and time format which does match any of the CSVW data format options."
}
The titles property here matches the header text in the CSV file. Because the timestamp used in EnergyPlus results files is a non-standard format, the datatype given here is a string and an explanation of why this is the case is given in the rdfs:comment property. The dc:description and schema:variableMeasured properties are included to match the method used for the remaining columns in the dataset.
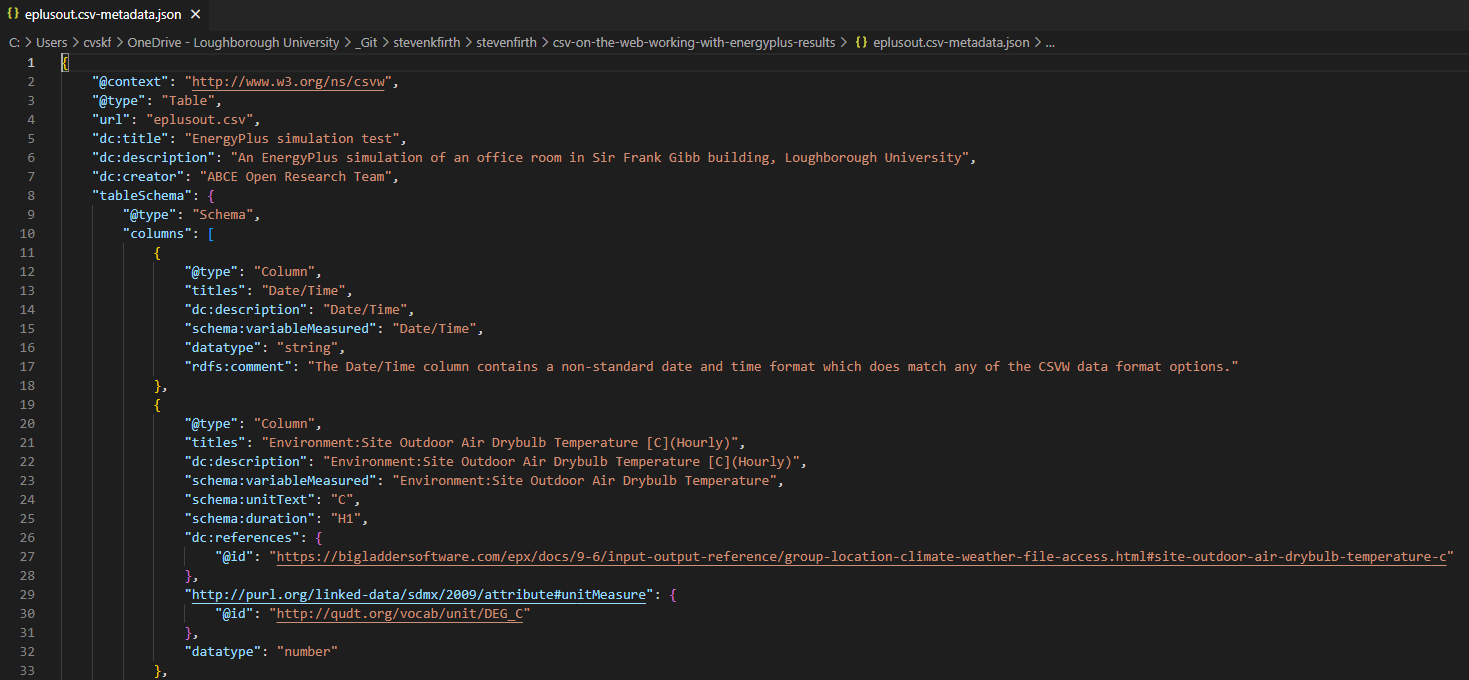
The outdoor temperature Column Description object
The Column Description object for the second column in the CSV file is:
{
    "@type": "Column",
    "titles": "Environment:Site Outdoor Air Drybulb Temperature [C](Hourly)",
    "dc:description": "Environment:Site Outdoor Air Drybulb Temperature [C](Hourly)",
    "schema:variableMeasured": "Environment:Site Outdoor Air Drybulb Temperature",
    "schema:unitText": "C",
    "schema:duration": "H1",
    "dc:references": {
        "@id": "https://bigladdersoftware.com/epx/docs/9-6/input-output-reference/group-location-climate-weather-file-access.html#site-outdoor-air-drybulb-temperature-c"
    },
    "http://purl.org/linked-data/sdmx/2009/attribute#unitMeasure": {
        "@id": "http://qudt.org/vocab/unit/DEG_C"
    },
    "datatype": "number"
}
Here the titles property matches the header text in the CSV file. The dc:description property is given the header text as well. In the EnergyPlus documentation there is further information about what this particular variable represents and this is linked to using the dc:references property. Note that the value of the dc:references property is another object with an @id property. This means that the dc:references value is a URL (in this case http://bigladdersoftware.com/…). Following the advice in the CSV Primer (and as explained in a previous blog post on Working with Units of Measure) we can include a formal statement about the units of this variable using the http://purl.org/linked-data/sdmx/2009/attribute#unitMeasureproperty and the QUDT vocabulary (here degrees Celsius are represented using the QUDT URL http://qudt.org/vocab/unit/DEG_C).
Finally the schema.org vocabulary was used to provide a more formal description of the information within the column header. schema:variableMeasured is used to describe the variable (in the case this includes the feature of interest - Environment - and the quantity under study - Site Outdoor Air Drybulb Temperature). schema:unitText provides another opportunity to state the units of the variable in this case as a simple text string (’C’). schema:duration is used to formally describe the time interval of the variable (in this case ‘H1’ refers to ‘one hour’ i.e. hourly time intervals - see here for more details).
The remaining Column Description objects
The same process was completed for the remaining columns in the ‘eplusout.csv’ file. As there were many columns in the file, the process was automated using a Python script written in a Jupyter Notebook (available to view on GitHub here).
The final CSVW dataset was placed on the Loughborough University Research Repository here: https://figshare.com/s/464885898d0041bfa8fd
An example of analysis using the CSVW format
Once the metadata.json file is created, this can be used in the analysis of the data in the CSV file.
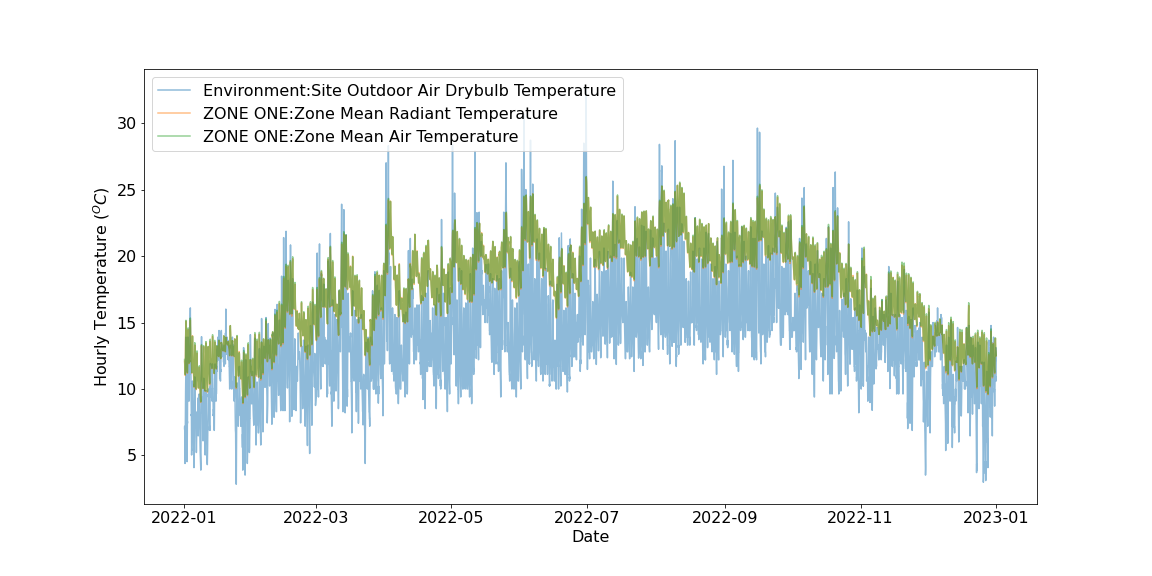
An example of this has been created and is available in a Jupyter Notebook on GitHub here. In this example the metadata.json file is used to filter the columns in the CSV file and return only those variables which are measured in degrees Celsius and which have an hourly time interval.
fig, ax = plt.subplots(figsize=(16,8))
for i,x in enumerate(metadata_dict['tableSchema']['columns']):
    if x.get('http://purl.org/linked-data/sdmx/2009/attribute#unitMeasure',{}).get('@id',None)==\
            'http://qudt.org/vocab/unit/DEG_C':
        if x.get('schema:duration',None)=='H1':
            ax.plot(df[x['titles']][48:], alpha=0.5, label=x['schema:variableMeasured'])
ax.set_xlabel('Date')
ax.set_ylabel('Hourly Temperature ($^{O}C$)')
ax.legend()
plt.rcParams.update({'font.size': 16})
fig.savefig('time_series_plot.png')
plt.show()
print('Figure X: Hourly temperatures vs. time for an EnergyPlus simulation.')The resulting plot is:
Summary
This blog post has shown a method for creating a CSVW metadata.json file to accompany an EnergyPlus results CSV file. This demonstrates that EnergyPlus results can be shared using the CSVW format, making the data more understandable and reusable.
The approach taken here shows just one method of creating the CSVW files, there are many other ways that this could be done. There no 'right' method here but over time it's possible that the EnergyPlus community could reach an agreement on a best practice approach for creating the metadata files.
Further information
- The GitHub page with the script which created the metadata.json file: https://github.com/stevenkfirth/stevenfirth/tree/main/csv-on-the-web-working-with-energyplus-results
- The GitHub page with the analysis example: https://github.com/building-energy/ABCE_Open_Data_Project/tree/main/internal_test_datasets/simulation
- The final dataset on the Loughborough University Research Repository: https://figshare.com/s/464885898d0041bfa8fd
- My blog posts on CSVW